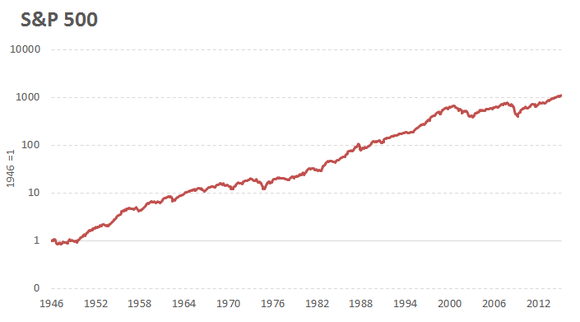
S&P 500’s Return from 1946 to 2015
Ok, the period is a bit long. It stretches over 70 years since 1946, which is 3 years earlier before my father was born.
What it means is: if you invested ONLY $ 1000 in S&P 500 since 1946 and held it till now (year 2015) while reinvesting all dividends, you would now be a millionaire worth at least $ 1 100 000.
By checking the historical price of S&P500 in Jan 1946, it was 18. On 9 September 2015, it was 1942. Based on the price alone, it only gives 107-fold (1942 / 18 = 107) during the 1946-2015 period. The another 993-fold (of 1100) is obtained by reinvesting the dividends. Reinvesting dividend has the invisible power of compound effect that is, most of the time, hidden from the price chart. So most people don’t know about it.
However, it would not be a smooth ride. Far from it. There were lots of bumps here and there on the road.
Below were 20 major declines of at least 10 % up to 56.8 % during these periods.
| Period | Stocks Decline |
| May 1946 – May 1947 | 28.4 % |
| June 1948 – June 1949 | 20.6 % |
| June 1950 – July 1950 | 14 % |
| July 1957 – October 1957 | 20.7 % |
| January 1962 – June 1962 | 26.4 % |
| February 1966 – October 1966 | 22.2 % |
| November 1968 – May 1970 | 36.1 % |
| April 1973 – October 1974 | 48 % |
| September 1976 – March 1978 | 19.4 % |
| February 1980 – March 1980 | 17.1 % |
| November 1980 – August 1982 | 27.1 % |
| August 1987 – December 1987 | 33.5 % |
| July 1990 – October 1990 | 19.9 % |
| July 1998 – August 1998 | 19.3 % |
| March 2000 – October 2002 | 49.1 % |
| November 2002 – March 2003 | 14.7 % |
| October 2007 – March 2009 | 56.8 % |
| April 2010 – July 2010 | 16 % |
| April 2011 – October 2011 | 19.4 % |
| June 2015 – August 2015 | 11.9 % |
US stocks rose 1100-fold during this period: Stocks for the long run?
Looking back (way, way back), those “catastrophic” market falls were just some minor blips on the chart. If people had a superpower memory, they would be optimistic and bullish about stock markets and would expect terrible things to happen regularly. But that is not the case. They expect the world is going to end soon, all the time.
Luckily we have this chart that shows us something that would otherwise be invisible for most of us: stocks rise over the long (very long) term.
Stocks have the best return out of all asset classes. Why? Because the world is progressing each and every day. People are living a better life compared to history. People are much much more productive then 70 years ago due to technological advances.
Most people nowadays go to university, most of them own their own transport (be it car, bike, motorbike, etc) and they also own computer, mobile phone, etc. We have a better medical technology and people are living a longer life. None of these is possible in the past.
When we buy stocks, we are buying a piece of these progresses. Therefore, it is a good choice to buy stocks for the long run. For more detail, read this book by Jeremy Siegel: Stocks for the Long Run 5/E: The Definitive Guide to Financial Market Returns & Long-Term Investment Strategies.
However, not many were able to benefit from these long term stocks investments. People can’t stand them for the short run due to the high volatility in the stock markets as we have seen from the table above. Fluctuations unnerve investors.
Note: the data above is true if you are buying index fund like S&P 500 or the “market” (a bucket of stocks), not a particular stock or company which can go bust at anytime.
Final thought: what about inflation?
In order to put things into perspective, I asked my father what was the cost of a bowl of kolok mee when he was young (about 50 years ago). “It was 30 cents and it was only a small bowl of kolok mee compared to what we have today”. This day, a bowl of normal sized kolok mee cost around RM 5. So the inflation rose about 16.7-fold over 50+ years.
Compare the impact of inflation to 1100-fold return from stock investment, the stocks beat inflation by dozens of streets (å‡ åæ¡è¡—). Of course, this is only a rough guide (as the saying goes, it is better to be approximately right than precisely wrong) but it provides a good approximation to understanding the impact of inflation over stock investments. Or if you know someone who lives longer, you could travel back in time to get a better approximation of the impact of inflation over this 70-year period by asking them about their living cost at that time. 🙂