Tag Archives: Finance

2020 The Shape of Net Worth Growth


Today is the last day of the year 2020. It is time for reflection.

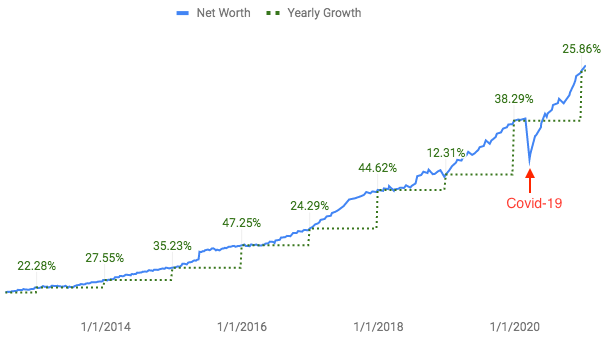
Life threw us a curve ball. Covid-19 made a big dent to the chart. 9 March 2020 marked the darkest day of my investing life. Market was in free fall. Two weeks later, on 23 March, the market bottomed. It almost set me back one year of growth back to the beginning of 2019.

Crisis accelerates wealth transfer. The sun will continue to shine after the storm. Stay strong!

The net worth is growing at roughly 33% year-over-year since 2012.

This growth is driven by:

  • human capital via working and
  • financial capital via investing.

Here, the human capital played a bigger role in the growth.

Your ability to work is the safest and highest returning asset.

Carolyn McClanahan

An average person’s lifetime earnings are around $ 2 millions assuming $ 50 k earning per year for 40 years. In another words, human capital is worth millions of dollars. Everyone should take advantage of it while contributing to the society to improve human living condition. You win and the society wins too.

Human capital converts time and effort into financial capital via saving.

The power of saving:

  • 1% increase in saving rate has more impact than the same increase in investment return when the net worth is small.
  • Saving is within my control whereas investment return is not. Strive for higher saving rate rather than higher investment return.

As the net worth reaches a certain level in the future, the financial capital will take over the human capital as the main contributor to the growth.

That is the point where financial independence is achieved. After this point, the money will grow faster than you can spend it. This is a common problem faced by most billionaires, but it is a nice problem to have I imagine.

Thinking vs Sitting

Which skill is more important when it comes to investing? Thinking or Sitting?

It never was my thinking that made the big money for me. It always was my sitting. Got that? My sitting tight!

Jesse Lauriston Livermore, 1877-1940

Reality and my thinking sometimes don’t overlap. This happens when my ego clouds my thinking causing me to overthink my investment.

Delusion is created by the gap between perception and reality. I called it mind bubble that will pop anytime just like market bubble when hit by the reality.

My thinking makes no big difference to the return. The market does not know I am investing in it. What I think does not impact nor influence the market. The market does not care about what I think. I can’t bluff the market.

It is better to let data guides my thinking rather than thinking in vacuum when making investment decisions.

The world is fundamentally unpredictable. Remove predictions to improve decisions.

All of humanity’s problems stem from man’s inability to sit quietly in a room alone.

Blaise Pascal, 1623-1662

The biggest risk of investing does not come from the market. It comes from the investors themselves who can’t sit tight during market crisis.

Market is here to serve us rather than the other way around. If we are being controlled by the market, then we are doing ourselves a disservice.

Sitting skill matters. It is the time in the market that makes most of the difference. Missing a few best days in the stock market can derail and damage any investment plan.

The longer the money stays in the market, the better and harder the compounding effect works for us.

Compounding effect works best when it is uninterrupted.

In order to have a really good investment result, all you need is patience.

John Templeton, 1912-2008

Sitting skill wins by a mile.

There is little correlation between investment effort and investment results because the world is driven by a few tail events.

Morgan Housel

Tail events create big gains that cannot be predicted after all. Buy the whole world for maximum exposure.

Within a portfolio of stocks, some will do badly, most will do fine and a few will do extremely well. The problem is I don’t know which is which in advance.

Any stock could have its days.
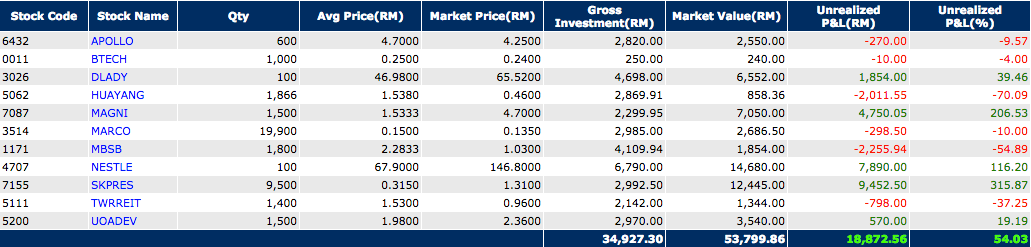
Invest for dividend

I am investing for dividend. Dividend stocks are income-producing assets.

Dividend investing is boring by nature, unfashionable and takes time to get results (that is the hard part for most people). It is like watching the grass grow or watching the paint dry… in a dark room. It is not for everyone. It is designed for those who have good sitting skill.

A key factor to get wealthy is to buy assets and let them work for us 24/7. It is a slow and steady way to get wealthy. The counterintuitive law of compounding effect tells us that we need to slow down in order to get ahead. After all, tortoise always wins over the long run.

If it is the right thing to do, there is no need to rush. If it is the wrong thing to do, there is no point to rush. Go slow to go fast.

If the direction is wrong, moving fast doesn’t help.

The paradox here is that the slower road almost always proves to be faster in the end.

William Green

If we can survive the boredom of dividend investing, we will be hugely rewarded financially.

Good investors think like a businessman. I am growing my investment business by:

  • reinvesting all dividends for future growth.
  • expanding into new markets to capture new opportunities.

Started with Malaysian stocks in 2013. Then moved to Singaporean stocks since 2017. Next year, I will be exploring Hong Kong stocks for dividend. One small step at a time to build multiple streams of incomes.

Below are some statistics about stock markets in Malaysia, Singapore and Hong Kong as of 2019:

Country Number of Listed Companies Market Capitalisation (USD)
Malaysia 919 $403.96B
Singapore 470 $697.27B
Hong Kong 2272 $4899.23B
Stock Markets in Malaysia, Singapore and Hong Kong

Hong Kong stock market is larger than stock markets in Malaysia and Singapore combined in term of number of companies and market capitalisation.

Also, Hong Kong does not impose withholding tax on dividends, interests or rents.

Go fishing where the fish are.

Mohnish Pabrai

Go to where the money is to grow the net worth.

Life is a blank check, waiting for you to fill in the numbers.

Anonymous


2018 Stock Market Returns of Lump Sum Buy-and-Forget Investment Strategy for The Last Five Years

This is a documentation about an on-going experiment that I started since November 2013.

In November 2013, I opened a separate HLeBroking (Hong Leong Investment Bank Berhad) trading account to do a lump sum (one time) investment in Bursa Malaysia. I chose buy-and-forget as the strategy for this experiment because it requires the minimal effort to maintain.

The portfolio contains 11 stocks from different industries for diversification purposes.

Among the stocks that I bought are from consumer products (APOLLO, DLADY, MAGNI, NESTLE), trading/services (BTECH, MARCO), properties (HUAYANG, UOADEV), finance (MBSB), industrial products (SKPRES) and REITs (TWRREIT) sectors.

The portfolio is skewed heavily towards companies in consumer products sector. This is the sector that is the most immune to negative market volatility.

The amount I had at the time was RM 35008 and was distributed about equally among all stocks (except BTECH which was bought with the remainder of the available sum).

I bought most of the above stocks during the period between November 2013 and January 2014. And I never touched the account since then.

From the date of the first stock purchase (on 20 November 2013) till now (8 September 2018), it has been roughly 4.8 years (1753 days to be exact).

So how is the performance of the buy-and-forget portfolio?

Below is the snapshot of the account as of 8 September 2018 (you can click on the image to get a closer look):

HLeBroking Trading Account as of 8 September 2018

HLeBroking Trading Account as of 8 September 2018

The current market value of the portfolio is RM 53799.86, an increase of 54.03 % from invested capital of RM 35008.

This translates to roughly 9.36 % CAGR (Compound Annual Growth Rate).

Here is the formula to calculate CAGR:

    \[ r = \sqrt[n]{\frac{F}{P}} - 1 \]

It is derived from this formula:

    \[ F = P*(1 + r)^{n} \]

Where:
F is the current market value,
P is the invested capital,
r is the rate of return or CAGR,
n is the number of years.

Things to take notes

Based on the screenshot above, we can see that some stocks have done poorly (e.g. HUAYANG -70.09 %, MBSB -54.89 %, TWRREIT -37.25 %) while some stocks have done extraordinarily well (e.g.: SKPRES +315.87 %, MAGNI +206.53 %, NESTLE +116.2 %).

This is consistent with the saying that there are ups and downs in the market, which is absolutely normal and expected. We should have the stomach to withstand the price drop of the companies in our portfolio.

However, even with the ups and downs in the market, the portfolio turns out fine with more than 50 % gain till date. This is due to the fact that the downside is limited but the upside is unlimited.

The most a stock can drop is to zero while there is no limit to how much a stock can grow.

The upside has more than covered for the downside which is the case here.

Another way to interpret the result is that there are more value being created in the market than the value being destroyed in the market. Human is a highly creative living being and there is no limit to how much value can be created. This means there is an infinite value waiting to be released in the market.

In a nutshell, stock market is a favourable game to play.

It gets even better because I haven’t taken into account the dividends paid by these stocks.

Dividends received

Here is the table that shows all the dividends received during these 4.8 years.

Dividend from HLeBroking

DateCompanyCodeTypePayment (RM)
09/01/2015APOLLO6432150
06/01/2016APOLLO6432150
09/01/2017APOLLO6432First and final180
09/01/2018APOLLO6432First and final150
23/06/2016BTECH0011Final6.3
28/09/2016BTECH0011Interim7.3
23/06/2017BTECH0011Final8
28/09/2017BTECH00118
22/06/2018BTECH0011Final8
20/05/2014DLADY3026110
26/12/2014DLADY3026Interim and special110
19/05/2015DLADY3026Interim and special110
18/12/2015DLADY3026Interim and special110
19/05/2016DLADY3026110
29/12/2016DLADY3026Interim & special110
21/04/2017DLADY3026110
31/05/2017DLADY3026Special60
27/12/2017DLADY3026110
25/05/2018DLADY3026110
07/04/2014HUAYANG506270
15/10/2014HUAYANG506298
12/03/2015HUAYANG506270
16/10/2015HUAYANG5062112
21/04/2016HUAYANG506270
17/04/2017HUAYANG506237.32
17/10/2017HUAYANG5062Final37.32
30/04/2014MAGNI708750
06/11/2014MAGNI708780
20/04/2015MAGNI708750
20/11/2015MAGNI7087100
26/01/2016MAGNI7087120
26/04/2016MAGNI708775
28/10/2016MAGNI7087150
13/01/2017MAGNI7087Second & special75
12/04/2017MAGNI7087Special and interim90
27/10/2017MAGNI7087Final and special157.5
12/01/2018MAGNI708767.5
12/04/2018MAGNI7087Interim and special105
28/02/2014MARCO3514Third interim159.2
15/07/2015MARCO3514First and final39.8
16/06/2016MARCO3514First & final139.3
30/06/2017MARCO3514First and final99.5
13/07/2018MARCO3514First and final99.5
05/06/2014MBSB1171Final90
28/05/2015MBSB1171Final and special216
16/06/2016MBSB1171Final54
22/06/2017MBSB1171Final54
03/08/2018MBSB1171Final90
05/06/2014NESTLE4707175
24/09/2014NESTLE470760
27/05/2015NESTLE4707175
10/09/2015NESTLE470765
02/12/2015NESTLE470765
02/06/2016NESTLE4707130
29/09/2016NESTLE470770
02/12/2016NESTLE4707Second interim70
08/06/2017NESTLE4707Final130
21/09/2017NESTLE470770
14/12/2017NESTLE470770
31/05/2018NESTLE4707Final135
27/10/2014SKPRES7155Final161.5
26/10/2015SKPRES7155Final186.2
27/09/2016SKPRES7155Final332.5
27/10/2017SKPRES7155Final394.25
28/02/2014TWRREIT511170.73
27/08/2014TWRREIT511148.26
27/02/2015TWRREIT511140.36
28/08/2015TWRREIT511140.32
29/02/2016TWRREIT5111Final47.28
14/09/2016TWRREIT5111Interim40.32
28/02/2017TWRREIT511147.1
06/09/2017TWRREIT511140.32
28/02/2018TWRREIT511135.39
30/08/2018TWRREIT511126.46
17/07/2014UOADEV5200195
14/07/2015UOADEV5200195
15/07/2016UOADEV5200225
14/07/2017UOADEV5200First and final225
23/07/2018UOADEV5200First and final225
Dividend received between 20 November 2013 and 8 September 2018

In total, I received RM 8164.53 in dividends from 79 payments throughout this period.

The dividends constitute about 23.32 % (8164.53/35008) of the invested capital. This means about 23.32 % of my capital has been returned to me during this period.

Dividends can further reduce the downside of stock investment since I will never lose all my invested capital.

The average dividend yield is about 4.86 % (8164.53/4.8/35008).

This means the investment is generating an average of RM 141.74 of dividend per month (8164.53/4.8/12).

Taking into account the dividends, the CAGR becomes 12.62 %, a very satisfactory return for me given the minimal effort from me.

Using the rule of 72, the capital will double in about 5.7 years (72/12.62). This is less than a year from now (5.7 – 4.8 = 0.9 year) where my portfolio would have a market value of RM 2 * 35008 (including dividends). However, this is not guaranteed. There is always uncertainty in the market.

Final thoughts

In order to run this experiment, I need to have money that I don’t need. Money, the less you need it now, the more you will have it later.

Let the good companies work for you. Let your money works for you.

Capitalism works. Human is inherently motivated to create value. It is worth to invest in the market.

Finally, ignore day-to-day market price fluctuation since it is not meaningful. Let good companies take care of themselves.

Disclaimer: Don’t follow blindly the portfolio above. Understand what you buy to reduce your risk.

2017 was indeed a Bullish Year in Hindsight

I made a post on a new blogging platform steemit. You can read the post here 2017 was indeed a bullish year in hindsight.

Steemit is a blogging and social networking website on top of the Steem blockchain database. The Steem blockchain produces Steem and Steem Dollars which are tradeable tokens users obtain for posting, discovering, and commenting on interesting content.