What would be the return if I bought and held the blue chip stocks that constitute the Kuala Lumpur Composite Index (KLCI) 5 years ago or to be precise since July 2009?
Let find out.
Note: There are 30 companies in KLCI, but I can only find data longer than 5 years for 22 of the blue chip companies. That is why you only see 22 companies here. Also, over last 5 years, the companies that were listed in KLCI had changed. So the list below is only for reference only.
-
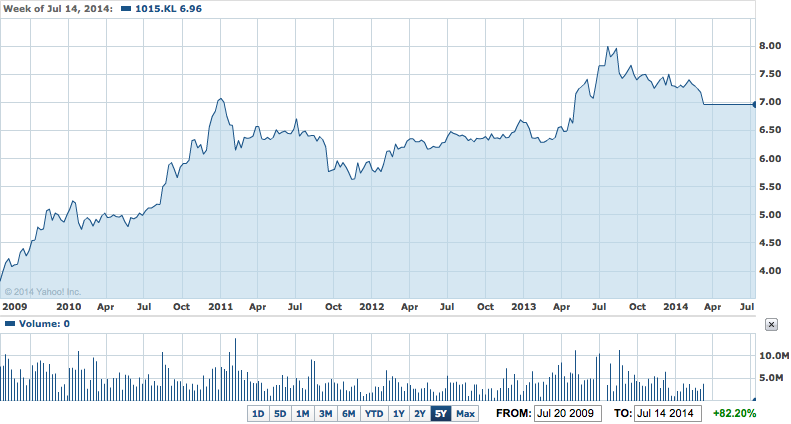
AMMB HOLDINGS BHD – AMBANK (1015)
82.20%
-
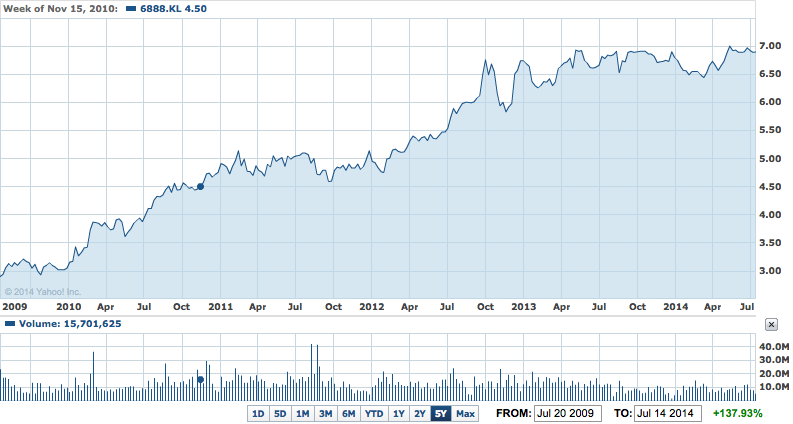
AXIATA GROUP BERHAD – AXIATA (6888)
137.93%
-
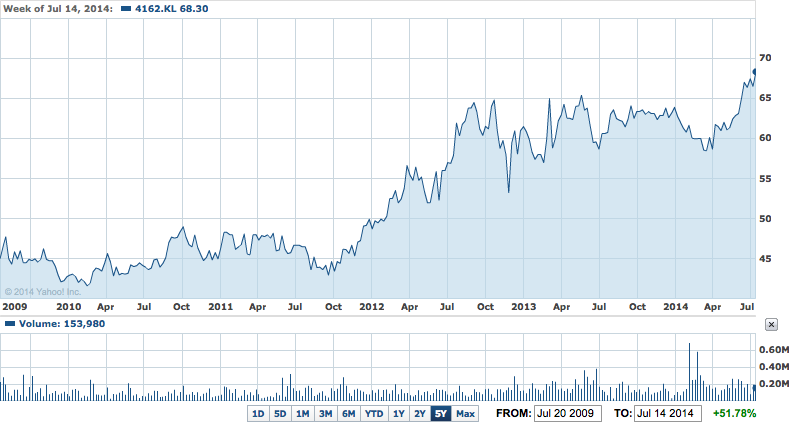
BRITISH AMERICAN TOBACCO (M) – BAT (4162)
51.78%
-
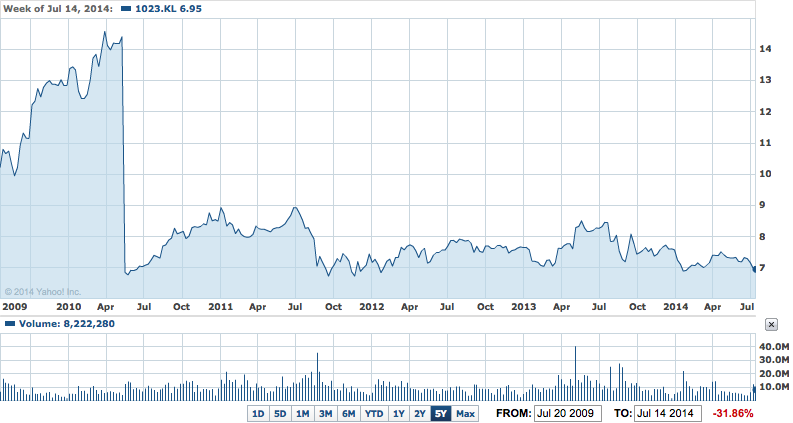
CIMB GROUP HOLDINGS BERHAD – CIMB (1023)
-31.86%
Update 140720: 阿尧 pointed out that there was a 1:1 split on 21 May 2010. Taking that into account, the return for CIMB during July 2009 – July 2014 would be +36.27%. But I will continue to use the old figure as a way to calculate worst case average return. -
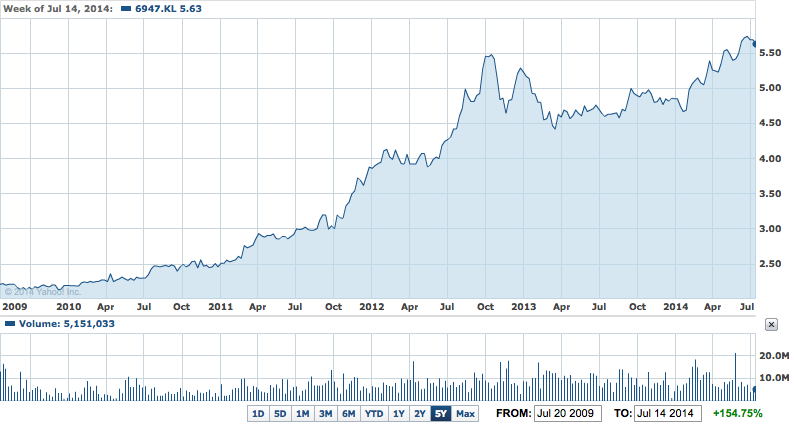
DIGI.COM BHD – DIGI (6947)
154.75%
-
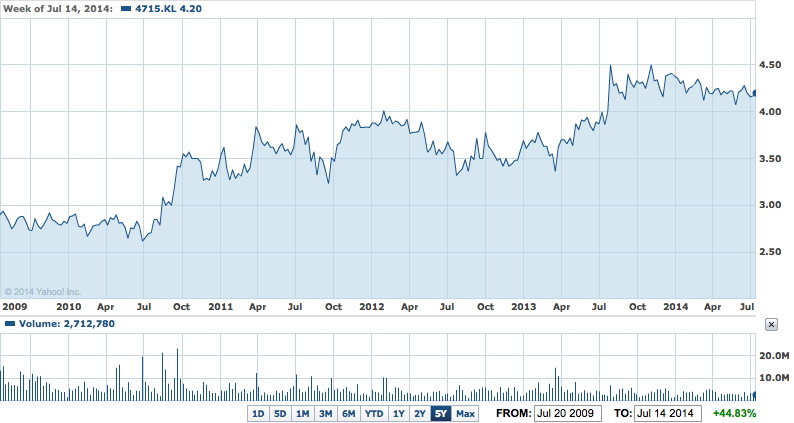
GENTING MALAYSIA BERHAD – GENM (4715)
44.83%
-
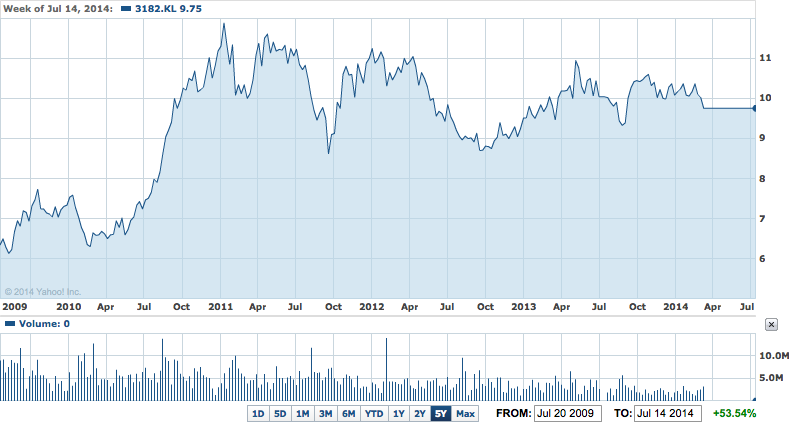
GENTING BHD – GENTING (3182)
53.54%
-
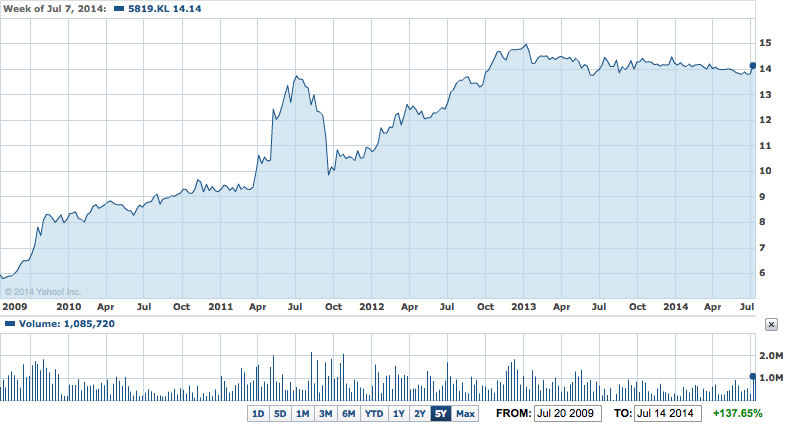
HONG LEONG BANK BHD – HLBANK (5819)
137.65%
-
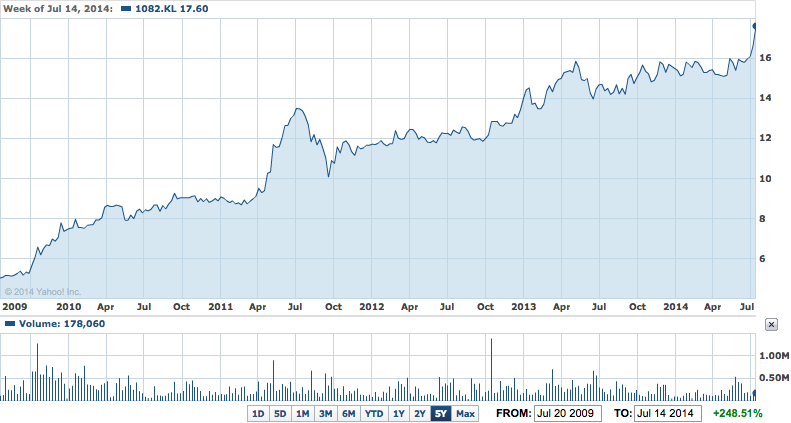
HONG LEONG FINANCIAL GROUP BHD – HLFG (1082)
248.51%
-
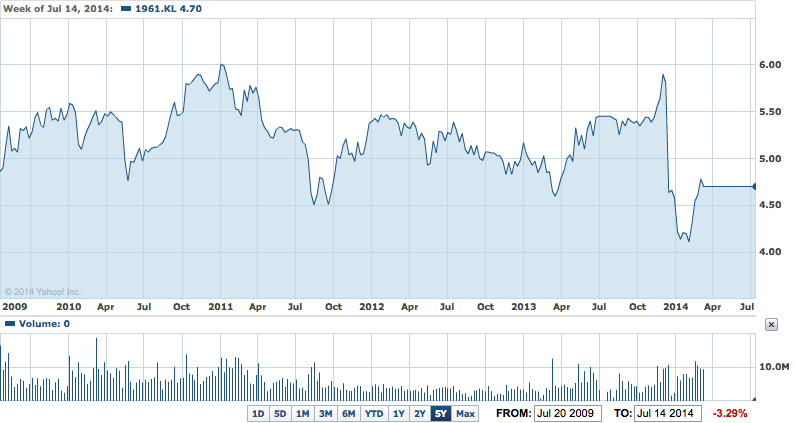
IOI CORPORATION BHD – IOICORP (1961)
-3.29%
-
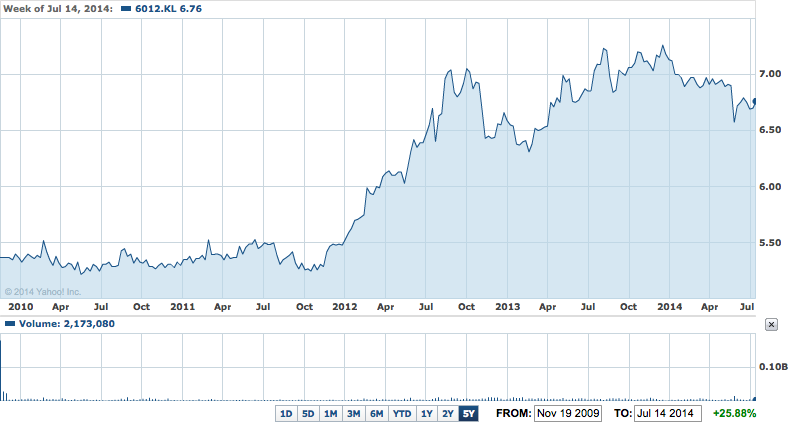
MAXIS BERHAD – MAXIS (6012)
25.88%
-
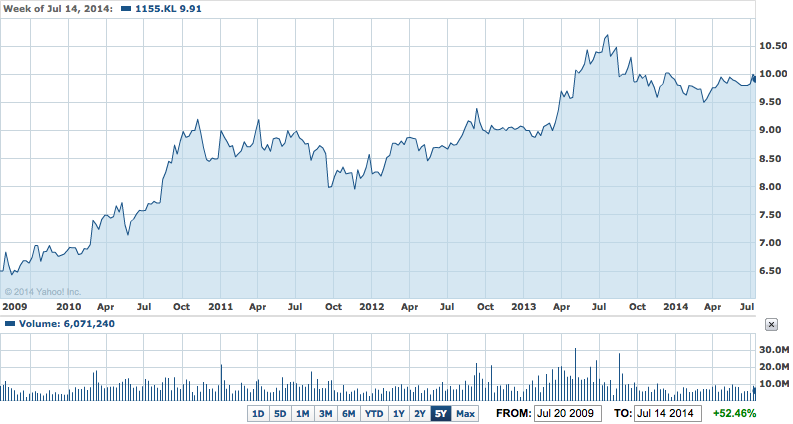
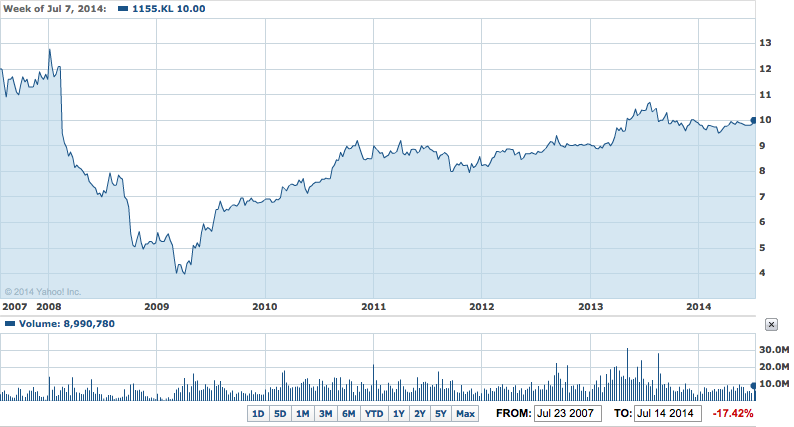
MALAYAN BANKING BHD – MAYBANK (1155)
52.46%
-
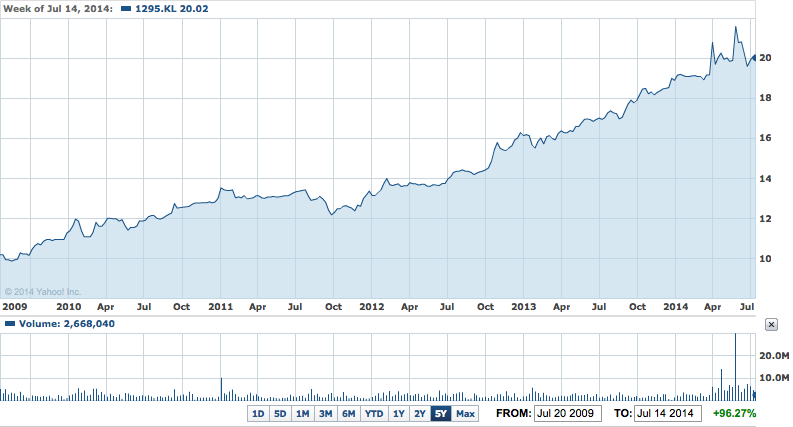
PUBLIC BANK BHD – PBBANK (1295)
96.27%
-
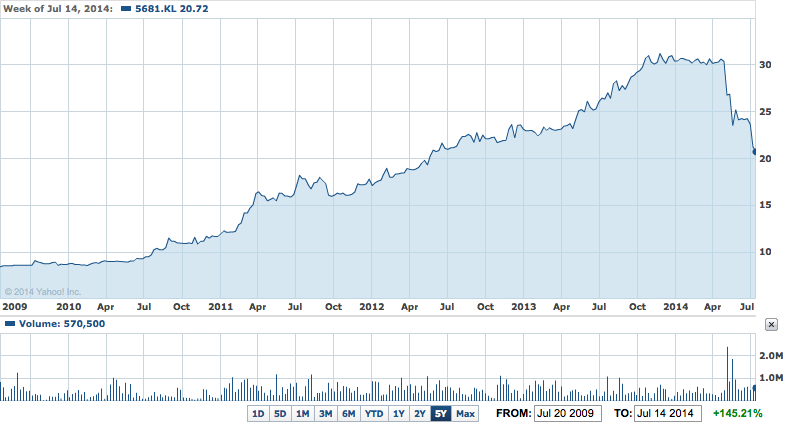
PETRONAS DAGANGAN BHD – PETDAG (5681)
145.21%
-
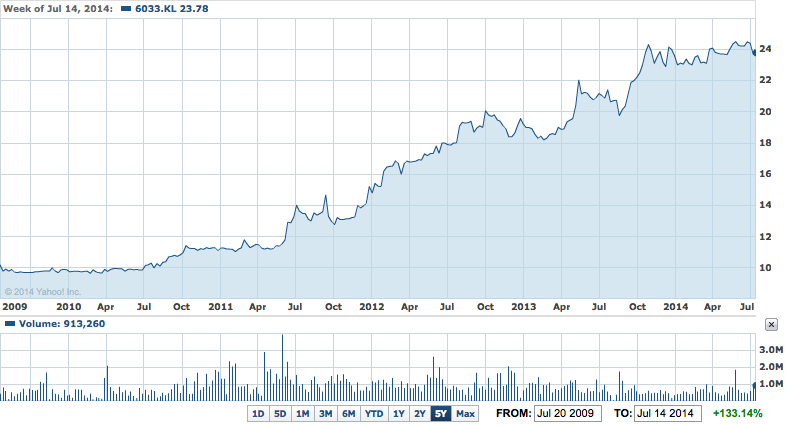
PETRONAS GAS BHD – PETGAS (6033)
133.14%
-
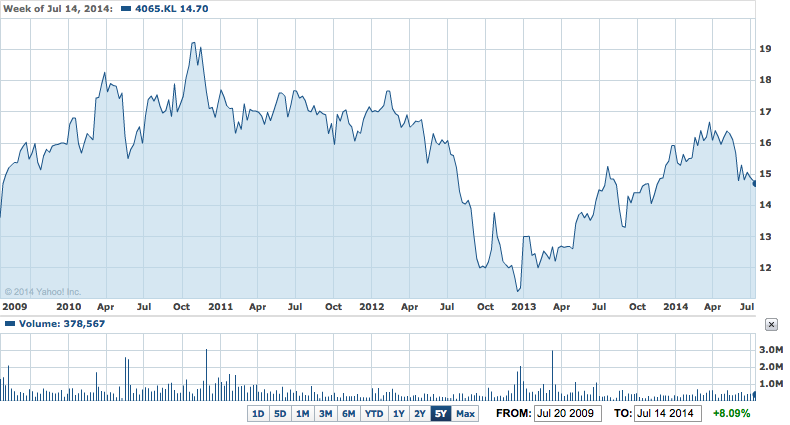
PPB GROUP BHD – PPB (4065)
8.09%
-
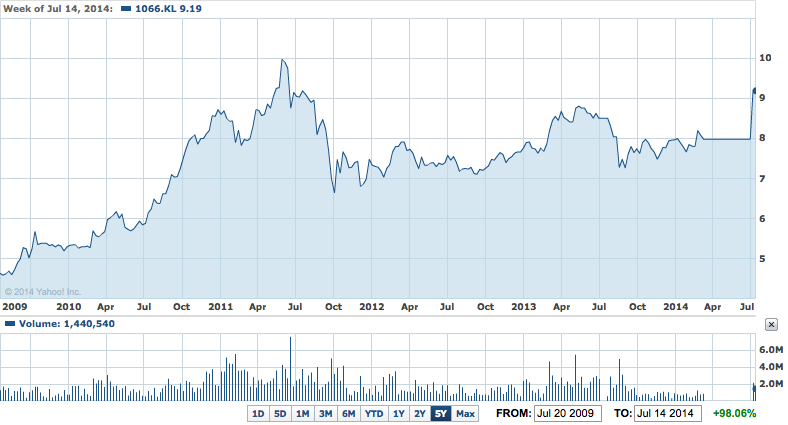
RHB CAPITAL BHD – RHBCAP (1066)
98.06%
-
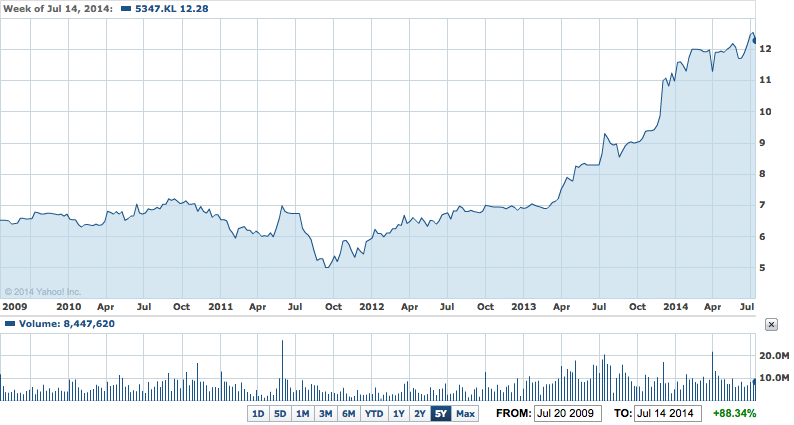
TENAGA NASIONAL BHD – TENAGA (5347)
88.34%
-
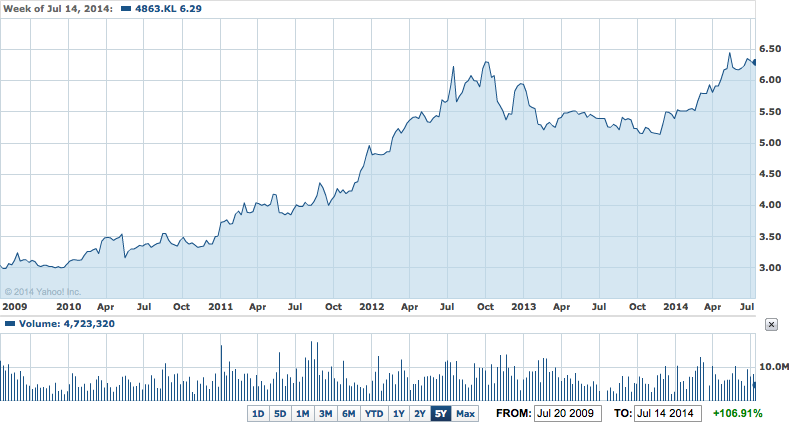
TELEKOM MALAYSIA BHD – TM (4863)
106.91%
-
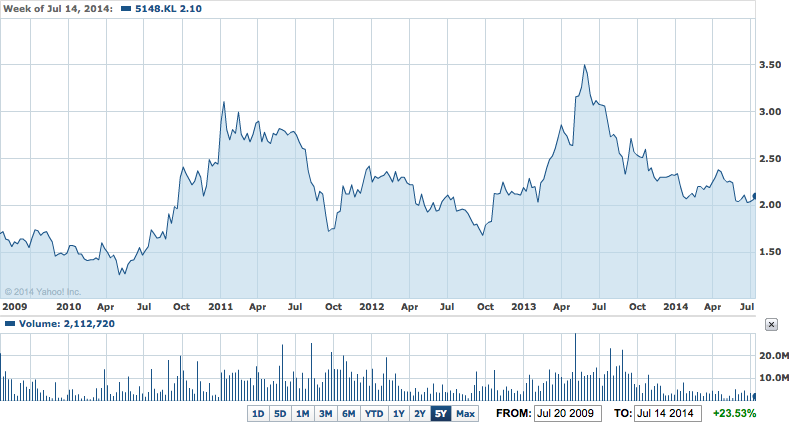
UEM SUNRISE BERHAD – UEMS (5148)
23.53%
-
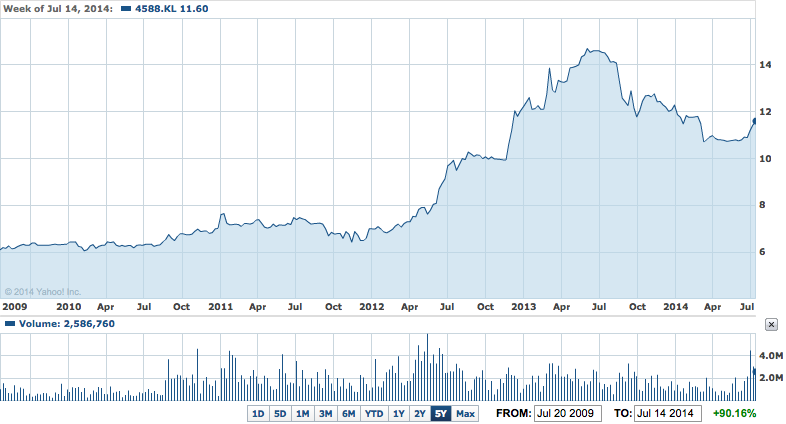
UMW HOLDINGS BHD – UMW (4588)
90.16%
-
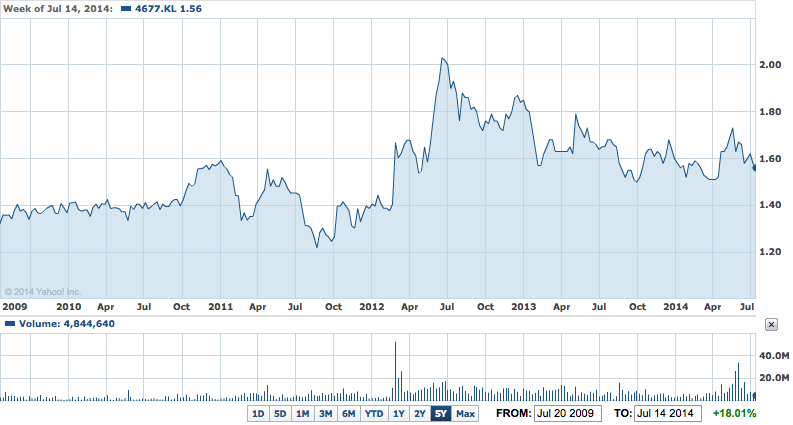
YTL CORPORATION BHD – YTL (4677)
18.01%
Summary For Holding Blue Chip Stocks 5 Years Ago
| Company | Return (%) |
|---|---|
| AMBANK | 82.20 |
| AXIATA | 137.93 |
| BAT | 51.78 |
| CIMB | -31.86 |
| DIGI | 154.75 |
| GENM | 44.83 |
| GENTING | 53.54 |
| HLBANK | 137.65 |
| HLFG | 248.51 |
| IOICORP | -3.29 |
| MAXIS | 25.88 |
| MAYBANK | 52.46 |
| PBBANK | 96.27 |
| PETDAG | 145.21 |
| PETGAS | 133.14 |
| PPB | 8.09 |
| RHBCAP | 98.06 |
| TENAGA | 88.34 |
| TM | 106.91 |
| UEMS | 23.53 |
| UMW | 90.16 |
| YTL | 18.01 |
| AVERAGE | 80.10 |
The total return would be 80.10% on average if I held these blue chip stocks 5 years ago. That is only 12.48% compounded annually (bear in mind that the dividend incomes are not included yet). This is a no-brainer investment considering that you don’t have to do extensive homework. You only buy and hold these blue chip stocks.
However, it will be a different story if I held the stocks longer. E.G.: the return from MAYBANK would be negative (-17.42%) if I held it for 7 years till now. Based on the observations, MAYBANK is one of the blue chip stocks that was deeply impacted by the financial crisis happened in 2008.
In fact, it was the worst stock among the 22 stocks listed above during 2008-2009. The other blue chip stocks were only mildly impacted by the crisis (considering today’s price). If you are interested, you can find it out yourself using Yahoo Finance.
