Category Archives: Number

Bursa Screener: The Ultimate Screener


I remembered two years ago when I started to take stock investment seriously, I struggled to find all the financial ratios and numbers like DE (Debt-to-Equity ratio or Debt/Equity ratio), Earnings Growth, Net Margin, etc of a company.

Debt is an important factor that I take very seriously when investing. There was no such tools or websites existed that provide the DE ratio. Another important factor to consider is the Earnings Growth that tells investors how much the earnings of a company had grown over a period of 5 or 10 years.

Side note: Why knowing how much debt is used is important? I learned the hard fact many years ago when I was experimenting with Forex demo account (where the broker allowed me to create 20 sub-accounts that never expire to play with). I tried different strategies and tested in parallel with all those 20 accounts and 100 % of the time the accounts went busted due to the high leverage (or high margin or borrowed money or in other words, debt). No exception. I realized from many rounds of tests with the demo accounts that with low or no debt involved, the accounts could survive longer, way way longer. Applying this learning to evaluating business, I tend to prefer low or no debt companies for long term investment. This does not mean that all debts are bad. But under some unforeseeable events, debts have a high probability to contribute to a financial crisis.

The only way I can get those numbers and ratios was through this book. However, the book is not cheap and it will be outdated in no time and I don’t want to depend on it for the rest of my life.

Although most of the websites or online tools that I know provide the basic and important financial ratios like PE (Price-to-Earning ratio or Price/Earnings ratio), ROE (Return-On-Equity), DY (Dividend Yield), etc, I knew something was missing.

Singapore Exchange, SGX where investors exchange Singaporean stocks, has a website that provides all those missing financial ratios for free through its convenient SGX stock screener. Compared to Bursa Malaysia’s website, it is lacking such a feature.
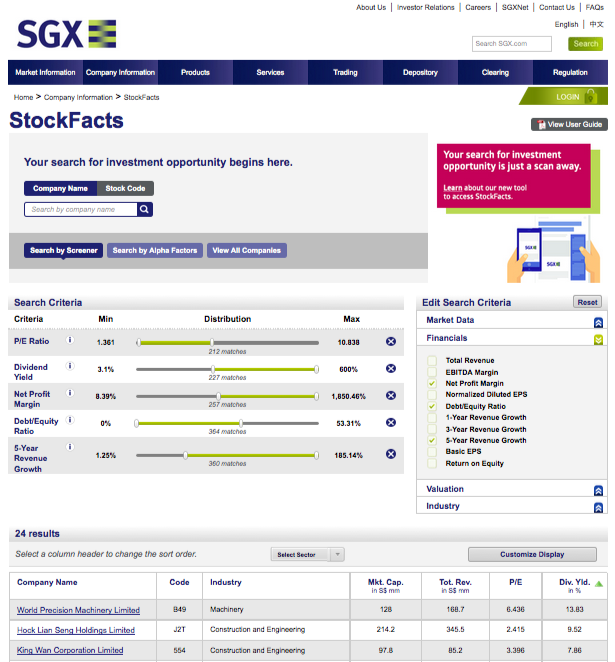
SGX Screener

SGX Screener

Over the years, I gained more experiences and knowledge through readings. Now I know some basic knowledge on how to read financial statements and derive the basic financial ratios that are important to me. So I no longer need to depend on the book that I mentioned in the beginning of this post.

Financial data is free and public

One day, I needed to change my home address. I realized that I received tons of financial reports during the last 2 years so I asked my broker whether I could ask the companies to stop sending me their annual reports. The answer was that it is IMPOSSIBLE to stop the delivery since the companies are required by LAW to inform their investors about their financial situation.

From this discovery, I realized that the financial data from listed companies is freely available (visit Bursa Malaysia) and everyone has free access to them. It is an important revelation for me because the things that I was searching were actually available all the time. You just need to know where to find them.

Bursa Screener

Knowing all the limitations of existing websites and tools, I decided to build my own tool for screening the Malaysian stocks using the freely available data. That’s how the Bursa Screener is born. It is developed to meet my own needs.
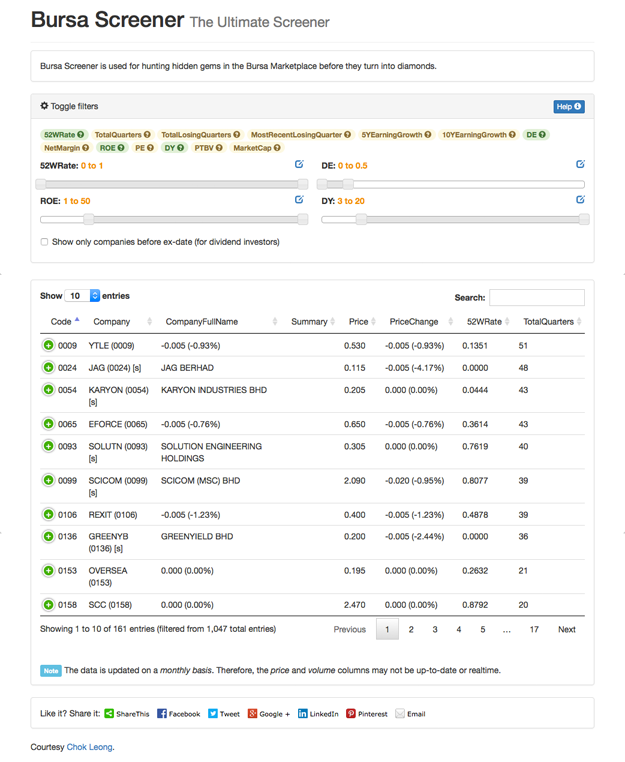
Bursa Screener

Bursa Screener

It provides a total of 13 filters (including the DE) for the whole Malaysian stocks. You can apply none or every filter at once or any combinations you like to search for the stock that fit your need.

Here is a list of all the filters:

  • 52WRate: to indicate where the current stock price is located compared to its 52-week low and high. 0 means the current price is at the low while 1 means the current price is at the high. I mentioned it at this post.
  • TotalQuarters: to indicate how many quarters the company is listed. It is useful to filter out companies that is less than 5 years old, for example.
  • TotalLosingQuarters: to indicate how many losing quarters out of the total quarters. A losing quarter is a quarter where the company is experiencing a net loss. It is useful to get a list of companies that never lose money by setting it to 0.
  • MostRecentLosingQuarter: to indicate when is/was the last losing quarter. 0 means the current announced quarter, 1 means a quarter earlier, 2 means 2 quarters earlier, etc. It is useful to find a turn-around company.
  • 5YEarningGrowth and 10YEarningGrowth: to indicate the growth of earnings over 5 and 10 years. It is calculated based on this post.
  • DE: to indicate the Debt-to-Equity or Debt/Equity ratio.
  • NetMargin: to indicate the Net-Earnings-to-Total-Revenue ratio. A high net margin shows that company has a strong competitive advantage.
  • ROE: to indicate the Return-On-Equity ratio.
  • PE: to indicate the Price-to-Earnings or Price/Earnings ratio.
  • DY: to indicate the Dividend Yield.
  • PTBV: to indicate the Price-To-Book-Value ratio.
  • MarketCap: to indicate the market capitalization of a company.

There is also a checkbox to select whether to show only those companies that are going to pay dividend so that you can buy before the ex-date.

The site is tested only on Firefox and it requires Flash to export the filtered results to CSV.

That’s it.

Investing in Bursa Malaysia is never so easy.


Invest Using Big Data: Warren Buffett Datafies Companies

Recently my colleague introduced us a book that he finds interesting. It is about big data and how it would transform how we live, work and think. One key point to understand big data is that it does not necessarily mean having access to gigabytes (1 073 741 824 bytes) or exabyte (1.1529215 × 10^18 bytes) of data. It is more about making use of all available data that you have access to right now. You turn those seemingly junk data into somethings that provide insights.

Everything around us can be “datafied”.

To datafy a phenomenon is to put it in a quantified format so it can be tabulated and analyzed.

Logging is one way of datafication. As a software engineer, doing logging is essential to understand and spot potential issues in a complex software. The information gathered through logging provides us the insight to know rather accurately which parts of the software is causing issues. It makes things crystal clear.

Having all the data available to you, you eliminate the guess work. You don’t have to make assumptions (that may or may not be true) based on your gut feeling. Things usually fail with unrealistic assumptions. With the data that you collected, you no longer work in the dark. Everything is in the data.

My key take-away from reading the book is that we should let the data thinks for us. The data reflects the reality. It is the true measurement of the reality. We no longer have to be a genius to make the right decisions. This makes me think of the legendary investor, Warren Buffett.

Invest Using Big Data

In some ways, I think Warren Buffett datafies companies. He turns every aspect of a company into data that he can analyze. He reads tons and tons of financial reports. He talks to CEOs. He understands a company inside out. He, together with other legendary investors like Peter Lynch invest using big data in one way or another. Nothing is guess work for them. The data tells them what is good and what is bad, so they invest based on the available data. They are using common sense.

Based on the data they have, they choose the companies which are quietly making tons of money to invest in. They don’t have to do complicated calculations or use advanced theory to make their investment decisions. The data is guiding them. The data tells them whether the company is making profit or losing money. And they invest only in companies that make money. Nothing more complicated than that.

With that being said, we still cannot ignore the fact that it requires huge human effort to sort and analyze this large amount of data. We still need to give our effort in order to extract the info we want. There is no short-cut with big data.

Final thought: we may have limited resources, but not deprived of data. Data is cheap resource that has high potential value. It is available everywhere like the air we breath. Documents, books, web, … all contain valuable data. We, ourselves, generate tons of data everyday. The places we go, the foods we eat, the clothes we wear, the movies we watch, … are data. We can leverage on the data we have to understand the world better.

5 Working Years to Financial Independence

This post is an extension to my recent post on my ideal cash flow. My previous post focused on the optimum cash flow that allows people to live without worrying about their financial situation. It is indeed a desired situation to be in for everyone (hmm, at least for me).

Today, I am going to study the time it takes for us to achieve the ideal cash flow. In other words, how long does it take to have the ideal cash flow so that you can declare to yourself that you are officially financial independence? Continue reading