I remembered two years ago when I started to take stock investment seriously, I struggled to find all the financial ratios and numbers like DE (Debt-to-Equity ratio or Debt/Equity ratio), Earnings Growth, Net Margin, etc of a company.
Debt is an important factor that I take very seriously when investing. There was no such tools or websites existed that provide the DE ratio. Another important factor to consider is the Earnings Growth that tells investors how much the earnings of a company had grown over a period of 5 or 10 years.
The only way I can get those numbers and ratios was through this book. However, the book is not cheap and it will be outdated in no time and I don’t want to depend on it for the rest of my life.
Although most of the websites or online tools that I know provide the basic and important financial ratios like PE (Price-to-Earning ratio or Price/Earnings ratio), ROE (Return-On-Equity), DY (Dividend Yield), etc, I knew something was missing.
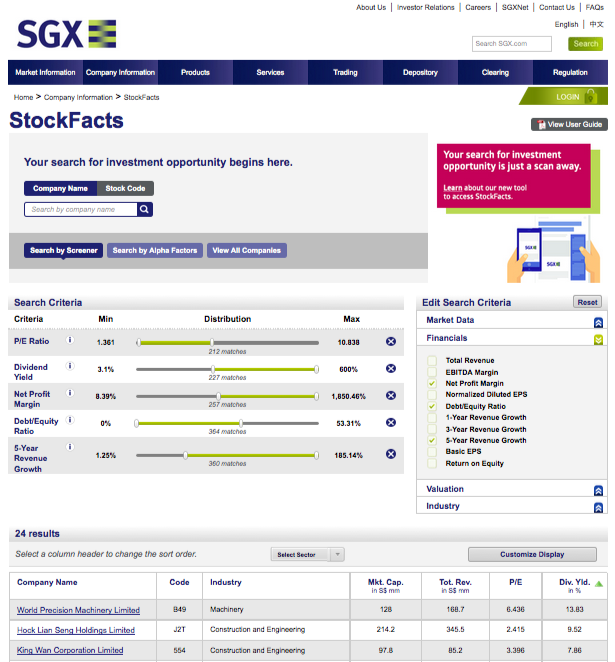
Singapore Exchange, SGX where investors exchange Singaporean stocks, has a website that provides all those missing financial ratios for free through its convenient SGX stock screener. Compared to Bursa Malaysia’s website, it is lacking such a feature.
Over the years, I gained more experiences and knowledge through readings. Now I know some basic knowledge on how to read financial statements and derive the basic financial ratios that are important to me. So I no longer need to depend on the book that I mentioned in the beginning of this post.
Financial data is free and public
One day, I needed to change my home address. I realized that I received tons of financial reports during the last 2 years so I asked my broker whether I could ask the companies to stop sending me their annual reports. The answer was that it is IMPOSSIBLE to stop the delivery since the companies are required by LAW to inform their investors about their financial situation.
From this discovery, I realized that the financial data from listed companies is freely available (visit Bursa Malaysia) and everyone has free access to them. It is an important revelation for me because the things that I was searching were actually available all the time. You just need to know where to find them.
Bursa Screener
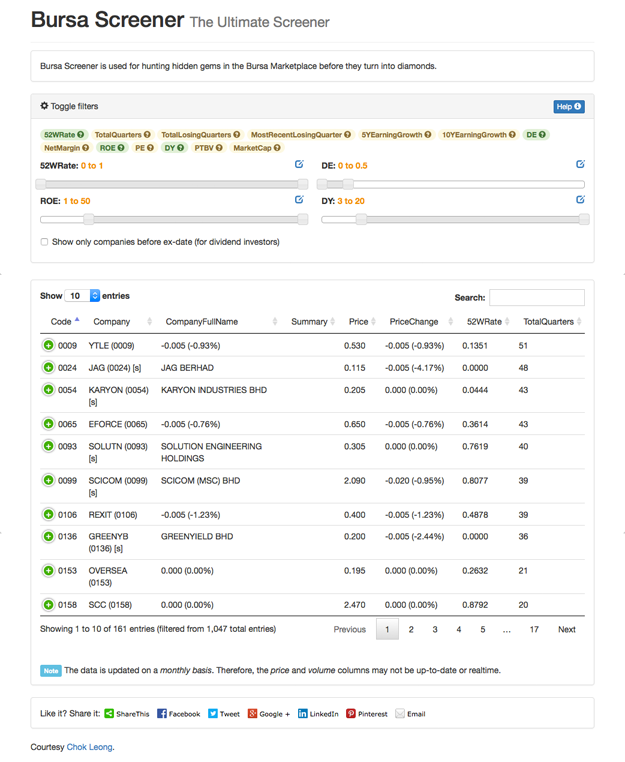
Knowing all the limitations of existing websites and tools, I decided to build my own tool for screening the Malaysian stocks using the freely available data. That’s how the Bursa Screener is born. It is developed to meet my own needs.
It provides a total of 13 filters (including the DE) for the whole Malaysian stocks. You can apply none or every filter at once or any combinations you like to search for the stock that fit your need.
Here is a list of all the filters:
- 52WRate: to indicate where the current stock price is located compared to its 52-week low and high. 0 means the current price is at the low while 1 means the current price is at the high. I mentioned it at this post.
- TotalQuarters: to indicate how many quarters the company is listed. It is useful to filter out companies that is less than 5 years old, for example.
- TotalLosingQuarters: to indicate how many losing quarters out of the total quarters. A losing quarter is a quarter where the company is experiencing a net loss. It is useful to get a list of companies that never lose money by setting it to 0.
- MostRecentLosingQuarter: to indicate when is/was the last losing quarter. 0 means the current announced quarter, 1 means a quarter earlier, 2 means 2 quarters earlier, etc. It is useful to find a turn-around company.
- 5YEarningGrowth and 10YEarningGrowth: to indicate the growth of earnings over 5 and 10 years. It is calculated based on this post.
- DE: to indicate the Debt-to-Equity or Debt/Equity ratio.
- NetMargin: to indicate the Net-Earnings-to-Total-Revenue ratio. A high net margin shows that company has a strong competitive advantage.
- ROE: to indicate the Return-On-Equity ratio.
- PE: to indicate the Price-to-Earnings or Price/Earnings ratio.
- DY: to indicate the Dividend Yield.
- PTBV: to indicate the Price-To-Book-Value ratio.
- MarketCap: to indicate the market capitalization of a company.
There is also a checkbox to select whether to show only those companies that are going to pay dividend so that you can buy before the ex-date.
The site is tested only on Firefox and it requires Flash to export the filtered results to CSV.
That’s it.
Investing in Bursa Malaysia is never so easy.

