This is a documentation about an on-going experiment that I started since November 2013.
In November 2013, I opened a separate HLeBroking (Hong Leong Investment Bank Berhad) trading account to do a lump sum (one time) investment in Bursa Malaysia. I chose buy-and-forget as the strategy for this experiment because it requires the minimal effort to maintain.
The portfolio contains 11 stocks from different industries for diversification purposes.
Among the stocks that I bought are from consumer products (APOLLO, DLADY, MAGNI, NESTLE), trading/services (BTECH, MARCO), properties (HUAYANG, UOADEV), finance (MBSB), industrial products (SKPRES) and REITs (TWRREIT) sectors.
The portfolio is skewed heavily towards companies in consumer products sector. This is the sector that is the most immune to negative market volatility.
The amount I had at the time was RM 35008 and was distributed about equally among all stocks (except BTECH which was bought with the remainder of the available sum).
I bought most of the above stocks during the period between November 2013 and January 2014. And I never touched the account since then.
From the date of the first stock purchase (on 20 November 2013) till now (8 September 2018), it has been roughly 4.8 years (1753 days to be exact).
So how is the performance of the buy-and-forget portfolio?
Below is the snapshot of the account as of 8 September 2018 (you can click on the image to get a closer look):
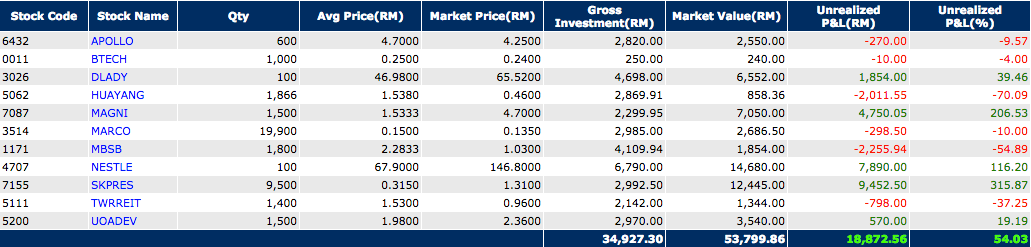
HLeBroking Trading Account as of 8 September 2018
The current market value of the portfolio is RM 53799.86, an increase of 54.03 % from invested capital of RM 35008.
This translates to roughly 9.36 % CAGR (Compound Annual Growth Rate).
Here is the formula to calculate CAGR:
![\[ r = \sqrt[n]{\frac{F}{P}} - 1 \]](https://www.chokleong.com/wp-content/ql-cache/quicklatex.com-477f9f402a6dee7b64fcc96692fbd68c_l3.png "Rendered by QuickLaTeX.com")
It is derived from this formula:
![\[ F = P*(1 + r)^{n} \]](https://www.chokleong.com/wp-content/ql-cache/quicklatex.com-ee0407688103eac1d363652a45ce6b9b_l3.png "Rendered by QuickLaTeX.com")
Where:
 is the current market value,
 is the invested capital,
 is the rate of return or CAGR,
 is the number of years.
Things to take notes
Based on the screenshot above, we can see that some stocks have done poorly (e.g. HUAYANG -70.09 %, MBSB -54.89 %, TWRREIT -37.25 %) while some stocks have done extraordinarily well (e.g.: SKPRES +315.87 %, MAGNI +206.53 %, NESTLE +116.2 %).
This is consistent with the saying that there are ups and downs in the market, which is absolutely normal and expected. We should have the stomach to withstand the price drop of the companies in our portfolio.
However, even with the ups and downs in the market, the portfolio turns out fine with more than 50 % gain till date. This is due to the fact that the downside is limited but the upside is unlimited.
The most a stock can drop is to zero while there is no limit to how much a stock can grow.
The upside has more than covered for the downside which is the case here.
Another way to interpret the result is that there are more value being created in the market than the value being destroyed in the market. Human is a highly creative living being and there is no limit to how much value can be created. This means there is an infinite value waiting to be released in the market.
In a nutshell, stock market is a favourable game to play.
It gets even better because I haven’t taken into account the dividends paid by these stocks.
Dividends received
Here is the table that shows all the dividends received during these 4.8 years.
Dividend from HLeBroking
| Date | Company | Code | Type | Payment (RM) |
|---|---|---|---|---|
| 09/01/2015 | APOLLO | 6432 | 150 | |
| 06/01/2016 | APOLLO | 6432 | 150 | |
| 09/01/2017 | APOLLO | 6432 | First and final | 180 |
| 09/01/2018 | APOLLO | 6432 | First and final | 150 |
| 23/06/2016 | BTECH | 0011 | Final | 6.3 |
| 28/09/2016 | BTECH | 0011 | Interim | 7.3 |
| 23/06/2017 | BTECH | 0011 | Final | 8 |
| 28/09/2017 | BTECH | 0011 | 8 | |
| 22/06/2018 | BTECH | 0011 | Final | 8 |
| 20/05/2014 | DLADY | 3026 | 110 | |
| 26/12/2014 | DLADY | 3026 | Interim and special | 110 |
| 19/05/2015 | DLADY | 3026 | Interim and special | 110 |
| 18/12/2015 | DLADY | 3026 | Interim and special | 110 |
| 19/05/2016 | DLADY | 3026 | 110 | |
| 29/12/2016 | DLADY | 3026 | Interim & special | 110 |
| 21/04/2017 | DLADY | 3026 | 110 | |
| 31/05/2017 | DLADY | 3026 | Special | 60 |
| 27/12/2017 | DLADY | 3026 | 110 | |
| 25/05/2018 | DLADY | 3026 | 110 | |
| 07/04/2014 | HUAYANG | 5062 | 70 | |
| 15/10/2014 | HUAYANG | 5062 | 98 | |
| 12/03/2015 | HUAYANG | 5062 | 70 | |
| 16/10/2015 | HUAYANG | 5062 | 112 | |
| 21/04/2016 | HUAYANG | 5062 | 70 | |
| 17/04/2017 | HUAYANG | 5062 | 37.32 | |
| 17/10/2017 | HUAYANG | 5062 | Final | 37.32 |
| 30/04/2014 | MAGNI | 7087 | 50 | |
| 06/11/2014 | MAGNI | 7087 | 80 | |
| 20/04/2015 | MAGNI | 7087 | 50 | |
| 20/11/2015 | MAGNI | 7087 | 100 | |
| 26/01/2016 | MAGNI | 7087 | 120 | |
| 26/04/2016 | MAGNI | 7087 | 75 | |
| 28/10/2016 | MAGNI | 7087 | 150 | |
| 13/01/2017 | MAGNI | 7087 | Second & special | 75 |
| 12/04/2017 | MAGNI | 7087 | Special and interim | 90 |
| 27/10/2017 | MAGNI | 7087 | Final and special | 157.5 |
| 12/01/2018 | MAGNI | 7087 | 67.5 | |
| 12/04/2018 | MAGNI | 7087 | Interim and special | 105 |
| 28/02/2014 | MARCO | 3514 | Third interim | 159.2 |
| 15/07/2015 | MARCO | 3514 | First and final | 39.8 |
| 16/06/2016 | MARCO | 3514 | First & final | 139.3 |
| 30/06/2017 | MARCO | 3514 | First and final | 99.5 |
| 13/07/2018 | MARCO | 3514 | First and final | 99.5 |
| 05/06/2014 | MBSB | 1171 | Final | 90 |
| 28/05/2015 | MBSB | 1171 | Final and special | 216 |
| 16/06/2016 | MBSB | 1171 | Final | 54 |
| 22/06/2017 | MBSB | 1171 | Final | 54 |
| 03/08/2018 | MBSB | 1171 | Final | 90 |
| 05/06/2014 | NESTLE | 4707 | 175 | |
| 24/09/2014 | NESTLE | 4707 | 60 | |
| 27/05/2015 | NESTLE | 4707 | 175 | |
| 10/09/2015 | NESTLE | 4707 | 65 | |
| 02/12/2015 | NESTLE | 4707 | 65 | |
| 02/06/2016 | NESTLE | 4707 | 130 | |
| 29/09/2016 | NESTLE | 4707 | 70 | |
| 02/12/2016 | NESTLE | 4707 | Second interim | 70 |
| 08/06/2017 | NESTLE | 4707 | Final | 130 |
| 21/09/2017 | NESTLE | 4707 | 70 | |
| 14/12/2017 | NESTLE | 4707 | 70 | |
| 31/05/2018 | NESTLE | 4707 | Final | 135 |
| 27/10/2014 | SKPRES | 7155 | Final | 161.5 |
| 26/10/2015 | SKPRES | 7155 | Final | 186.2 |
| 27/09/2016 | SKPRES | 7155 | Final | 332.5 |
| 27/10/2017 | SKPRES | 7155 | Final | 394.25 |
| 28/02/2014 | TWRREIT | 5111 | 70.73 | |
| 27/08/2014 | TWRREIT | 5111 | 48.26 | |
| 27/02/2015 | TWRREIT | 5111 | 40.36 | |
| 28/08/2015 | TWRREIT | 5111 | 40.32 | |
| 29/02/2016 | TWRREIT | 5111 | Final | 47.28 |
| 14/09/2016 | TWRREIT | 5111 | Interim | 40.32 |
| 28/02/2017 | TWRREIT | 5111 | 47.1 | |
| 06/09/2017 | TWRREIT | 5111 | 40.32 | |
| 28/02/2018 | TWRREIT | 5111 | 35.39 | |
| 30/08/2018 | TWRREIT | 5111 | 26.46 | |
| 17/07/2014 | UOADEV | 5200 | 195 | |
| 14/07/2015 | UOADEV | 5200 | 195 | |
| 15/07/2016 | UOADEV | 5200 | 225 | |
| 14/07/2017 | UOADEV | 5200 | First and final | 225 |
| 23/07/2018 | UOADEV | 5200 | First and final | 225 |
In total, I received RM 8164.53 in dividends from 79 payments throughout this period.
The dividends constitute about 23.32 % (8164.53/35008) of the invested capital. This means about 23.32 % of my capital has been returned to me during this period.
Dividends can further reduce the downside of stock investment since I will never lose all my invested capital.
The average dividend yield is about 4.86 % (8164.53/4.8/35008).
This means the investment is generating an average of RM 141.74 of dividend per month (8164.53/4.8/12).
Taking into account the dividends, the CAGR becomes 12.62 %, a very satisfactory return for me given the minimal effort from me.
Using the rule of 72, the capital will double in about 5.7 years (72/12.62). This is less than a year from now (5.7 – 4.8 = 0.9 year) where my portfolio would have a market value of RM 2 * 35008 (including dividends). However, this is not guaranteed. There is always uncertainty in the market.
Final thoughts
In order to run this experiment, I need to have money that I don’t need. Money, the less you need it now, the more you will have it later.
Let the good companies work for you. Let your money works for you.
Capitalism works. Human is inherently motivated to create value. It is worth to invest in the market.
Finally, ignore day-to-day market price fluctuation since it is not meaningful. Let good companies take care of themselves.
Disclaimer: Don’t follow blindly the portfolio above. Understand what you buy to reduce your risk.